Prolonging the Expansion
- On the back of global monetary easing and a reduction in geopolitical tensions, we believe that the time to the next global recession has extended. We favor a less defensive multi-asset portfolio that opportunistically seeks cyclical risk to benefit from the improved growth backdrop.
- However, the broad asset rally of 2019 leaves us with valuations across asset classes that may call for shifts in emphasis. Looking ahead, we expect pure beta exposures to deliver lower returns and higher volatility than experienced over the past decade, and certainly in 2019. Therefore, we believe active management across risk factors will be increasingly important to returns.
- We are selective regarding various sector and regional exposures, while also emphasizing relative value opportunities within asset classes. We believe equities should be the favored instrument to express risk, as generic corporate credit looks richer.
- Risk management remains crucial in light of potential disruptions from the U.S. elections, renewed geopolitical tensions, or other risks that loom large in an environment where expected returns are capped by valuations.
The past decade marked a tremendous return environment for most asset classes. 2019, in particular, was a banner year for assets with U.S. equities leading the pack, delivering 31.5%, and U.S. bonds returning 8.7%, as represented by the S&P 500 and Bloomberg Barclays U.S. Aggregate indices. However, with asset valuations decidedly more expensive today, the two key questions asset owners are asking are how much further this rally has to run and how to evolve risk posture in policy portfolios.
While we do not think the post-crisis expansion is likely to end over the coming year, we do expect pure beta exposures to deliver lower returns and higher volatility than experienced over the past decade, and certainly in 2019. As a result, we think active management across risk factors will be increasingly important to returns, with a keen eye toward digging deeper within portfolios to uncover alpha opportunities.
In particular, within equity markets, we are focused on potential secular disruptors (see the section Secular drivers: Monitor the disruptors), which have the ability to fundamentally alter the geopolitical, economic and business frameworks of the past. The asset management industry is not immune to these changes, and in response, PIMCO has made tremendous investments in our quantitative and analytics teams and models over the past several years (see the section Quantitative approaches to business cycle forecasting). We believe flexibility, quantitative rigor and adaptability will be key to succeeding in what is likely to be a lower return environment ahead.
Following a bumpy 2019 for global macroeconomic growth, we see the clouds lifting in 2020. While the global health crisis adds uncertainty to the economic outlook, we believe the economic and market risks will be temporary. With the cycle extended and recession risks reduced, we favor equities over hard duration and generic corporate credit, and have started the year with a constructive view toward risk.
Setting the stage: analyzing the macro backdrop
After a long period of slowing, cyclical growth momentum is bottoming in response to broad central bank policy easing. While the current PIMCO view only foresees a modest rebound in economic activity, the positive rate of change in growth momentum is important for asset markets. The environment we anticipate calls for a less defensive portfolio and one that opportunistically seeks cyclical risk to benefit from the improved growth backdrop.
Policy easing supports growth
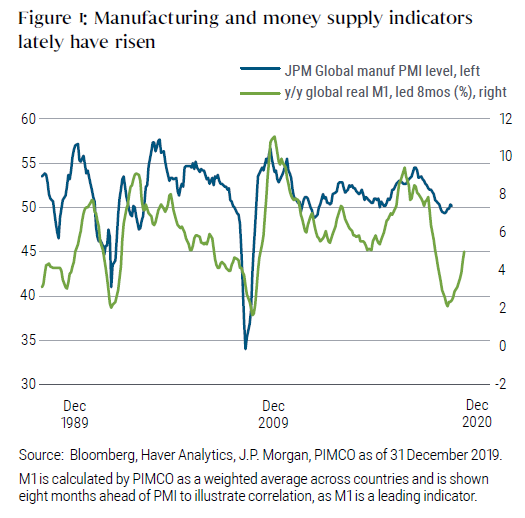
For most of the last two years markets have been grappling with the slowing growth environment representing a headwind for cyclical risk. In the last year this slowing culminated in a rising probability of recession, which resulted in a more forceful response from global central banks. Recently, the J.P. Morgan Global Manufacturing PMI, a measure of global manufacturing sentiment, improved in four of the last five months of 2019 and comes on the back of improvement in global real M1 money supply growth — empirically a good indicator of monetary policy conditions and a leading indicator of growth (see Figure 1).
Increasingly, the weight of evidence supports a more upbeat view. PIMCO’s earnings growth leading indicator has turned higher for the first time in almost three years. The earnings growth cycle appears to be in a soft landing. Positive and complementary growth signals are coming from other indicators as well, including a shift in earnings revision sentiment, higher commodity prices, and recent steepening of global yield curves.
To be sure, the coronavirus outbreak has injected new risks into the global outlook, particularly given the importance of China to global growth and its integration in global supply chains. While we recognize this as a risk to our outlook, we believe that the outbreak is likely to delay rather than upend our base case view on a bottoming of global growth. Extrapolating similar patterns of viral outbreaks like Severe Acute Respiratory Syndrome (SARS) to today suggests that we are likely to see a recovery in global industrial production playing out by midyear.
Easing political tensions positive for risk assets
While the situation is far from resolved, the temperature of U.S.–China trade tensions has been dialed back to simmer. The longer-term impact of the partial “Phase 1” trade deal (or any further negotiations on Phase 2) is yet to be seen, but China’s leadership seeks to limit further growth headwinds, and U.S. leadership wants a good deal in an election year. The U.S.–China trade relationship encompasses three of the disruptive forces we flagged at our latest Secular Forum: China, populism, and technology.
Also notable regarding trade, the United States–Mexico–Canada Agreement (USMCA) was signed with minimal changes from the North American Free Trade Agreement that it replaces, and the U.K. moved toward a “soft” Brexit outcome. Trade will remain a feature of market risk, but is less likely to surprise markets today.
Bottom line, within the last year, policymakers have removed two significant headwinds to the cycle – concerns over growth and a destabilizing trade conflict – which has set the stage for a more constructive 2020 outlook. Nevertheless, unforeseen monetary, trade, or geopolitical tensions (e.g., Iran) remain a prevalent risk that market participants should not write off completely.
Portfolio implications
After establishing our baseline view for the global economy in 2020, the critical question remains – what does this all mean for portfolio construction?
We favor a modest risk-on posture in multi-asset portfolios, expressed through an overweight to equities and duration close to flat as our starting point and adjusted from there depending on the balance of risk positions in the portfolio.
However, we are being selective in terms of sectors and country exposures and focusing on relative value opportunities within asset classes. Given our constructive near-term outlook, we believe that risk assets will continue to outperform in 2020, but we also recognize that asset prices are elevated and that an unforeseen shock could cause sentiment to reverse course. Prudent portfolio construction will be critical in the current environment, with alpha decisions likely accounting for a higher share of total returns and managing the downside risks associated with an aging expansion.
Longer-term, we are more cautious given the reality that central banks have exhausted their toolkit and thus have limited ammunition to buffer the economy from future shocks. We are also starting to observe classic behavior for an aging expansion, such as riskier forms of borrowing in the corporate sector. How should one reconcile these seemingly contrasting shorter-term and longer-term views? In essence, while the current expansion has been prolonged, the expected losses in the next recession are likely to be higher as a consequence.
Timing markets is an incredibly challenging endeavor, even for the most capable professional investors.
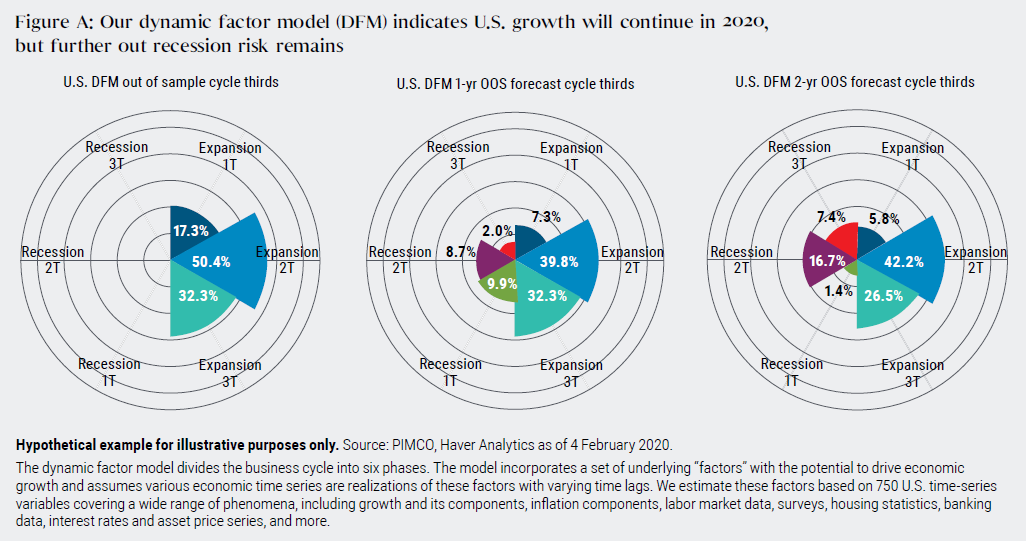
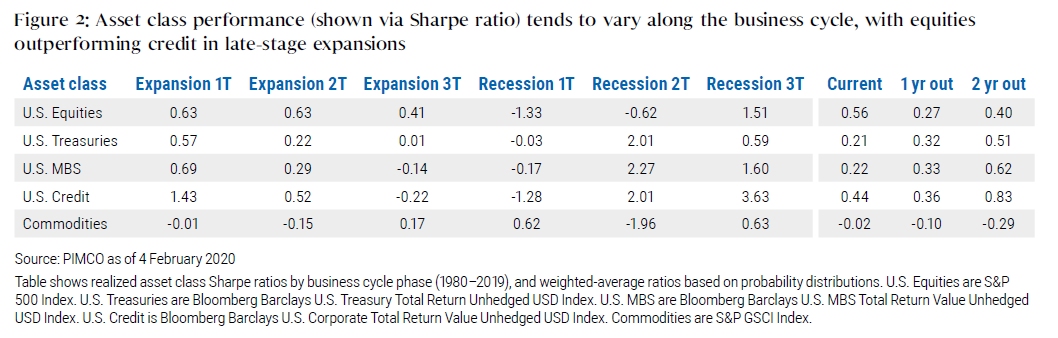
Importantly, investors should recognize that timing markets is an incredibly challenging endeavor, even for the most capable professional investors. Rather than focusing on a single path, investors should consider the probabilities of potential future outcomes to construct a portfolio designed to outperform in expectation, and that also offers sufficient downside resiliency. The optimal portfolio depends on the investment horizon and target holding period, as business cycle phases (and hence asset class return distributions) will transition over time (see Figure 2). For example, corporate credit historically has outperformed in mid-expansion, but typically lagged during the later phases of an expansion, during which equities continued to do well. Even with contained recession risks, over a longer-term holding horizon we can see the importance of maintaining a portfolio hedge of U.S. Treasuries and mortgage-backed securities (MBS).
As our business cycle models suggest, the economy is currently in the second phase of the economic expansion, which continues to argue for a risk-on stance within portfolios. Investors should be mindful, however, of changes to portfolio composition as the expansion ages into the final third, and consider layering portfolio hedges accordingly.
Asset class views for multi-asset portfolios
Equities
Global recession risks have diminished as global growth momentum is picking up along with monetary easing. Global equity valuations appear rich in absolute terms, but less so when normalized for cost of capital. Therefore, earnings growth remains an important variable, and we are constructive on global earnings growth for 2020. Earnings are also a key factor in the relative return profile of equities versus sovereign bond rates.
Given more policy support and macro data stability, we are shifting to a less defensive posture on equities in our multi-asset portfolios relative to the past couple of years, and we believe markets now offer attractive entry points into high quality, cyclically exposed sectors that currently trade with a relative valuation discount.
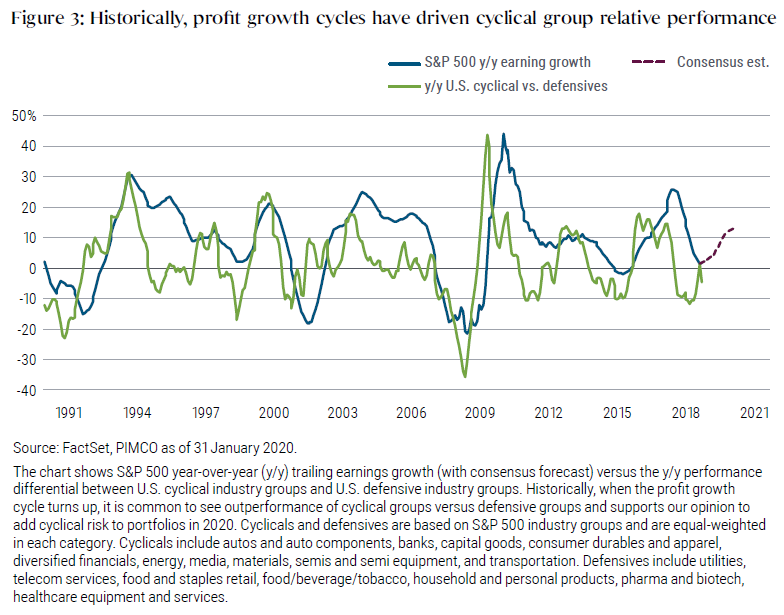
We like U.S. industrials, where we expect to see relative valuation expansion as global growth momentum improves. Again, earnings growth trajectory is an important driver for relative outperformance of cyclical stocks versus defensives (see Figure 3). We also like more cyclically exposed regions with a valuation anchor, like Germany and Japan. We are also modestly constructive on emerging market equities, which have lagged and are poised to benefit from improvement in manufacturing and global trade activity.
Along with the more cyclically exposed, high quality sectors and regions, we continue to favor alternative risk premia strategies like volatility sales and exposures to quality and value factors.
Rates
We are neutral on duration. Globally, markets are priced for low neutral rates and low term premium: Both factors make the asset class less attractive in absolute terms, though we continue to view it as an important portfolio hedge against major risk-off events and growth that disappoints our expectations. Despite the valuation headwind, the probability of major central banks hiking rates appears low as they await inflation to reach target, a trend that has surprised sovereign bond markets to the downside.
In multi-asset portfolios, we continue to see U.S. duration as more attractive than the rest of the world (see Figure 4). We believe the U.S. market has a higher potential for capital gains in the event the market again prices in a more recessionary scenario.
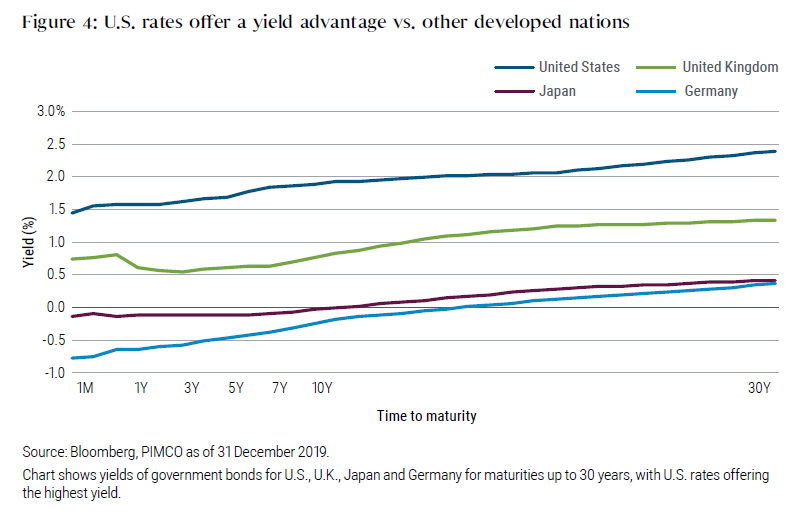
We continue to view the U.K. rates market as one of the richest among global developed economies. The Conservative Party victory in December’s election means we could likely see fiscal easing over the cyclical horizon, which should further put pressure on yields.
Looking at yield curves, we favor curve steepening positons in the U.S. This view is driven by valuations but also our belief that the front end will remain anchored over the cyclical horizon while we see potential for higher inflation expectations to be priced in further out the curve. Curve steepening positions should also have risk mitigation properties given the rise in U.S. government deficit and debt and the possibility that, over time, markets will demand more term premium in the event of further deterioration in the fiscal outlook.
Credit
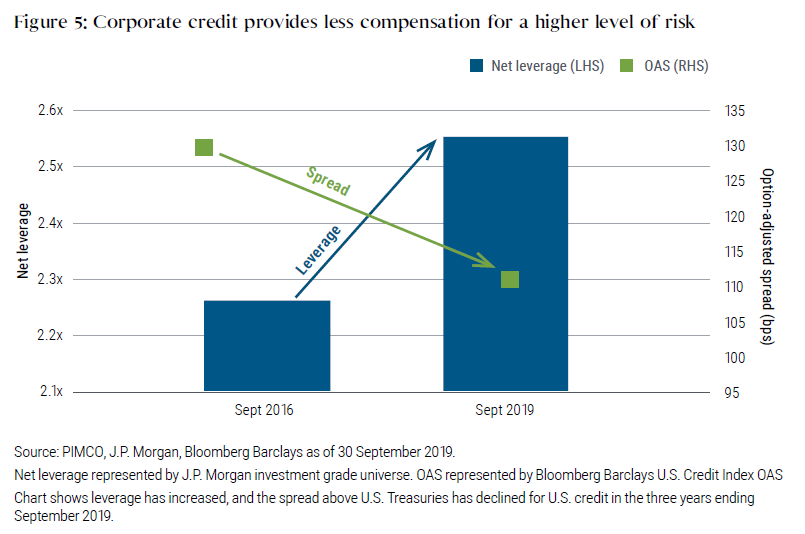
Our Cyclical Outlook calls for a nuanced view on credit. In U.S. investment grade markets, while leverage is stable, it remains elevated versus its long-term average, and the risks may not be adequately reflected in the spreads offered (see Figure 5). We continue to emphasize caution on generic nonfinancial corporate credit risk, but we also see value in select areas given the bifurcation in credit markets.
Market technicals remain supportive as the increase in low- and negative-yielding debt globally should drive demand for income-producing assets such as U.S. credit.
Valuations, or investment grade spreads, continue to price in low risk of a U.S. recession in the near term, in line with PIMCO’s economic forecast. However, we continue to monitor the potential disruptors in the market (discussed above).
Within credit, we emphasize bottom-up alpha and relative value opportunities to drive returns. We like names with robust fundamentals and with short-dated and default-remote characteristics.
We continue to focus on U.S. domestic credits with pricing power and high barriers to entry while avoiding secularly challenged credits and subsectors exposed to margin headwinds. We continue to like non-agency mortgages as offering relatively attractive valuation and a more defensive source of credit and carry and better technicals than generic corporate credit exposure. We also like agency MBS, which we believe offer attractive valuation, reasonable carry, and an attractive liquidity profile in comparison with other spread assets. We also favor opportunistically selling credit volatility in order to extract volatility risk premium.
Real assets
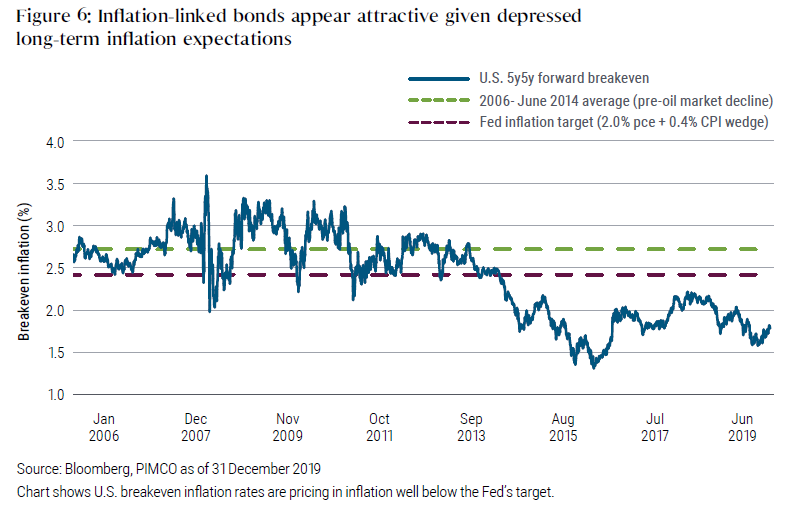
We continue to see value in U.S. Treasury Inflation-Protected Securities (TIPS) as an attractively valued hedge against unexpected upside U.S. inflation. While our baseline forecast for inflation in the U.S. is relatively benign, we believe medium-term upside risks outweigh downside risks given somewhat resurgent wages and potential for future expansionary fiscal policy.
Additionally, we expect a higher tolerance from the Fed and other central banks to allow for inflation overshoots given years of below-target levels.
Against this backdrop, U.S. breakeven inflation rates are pricing in inflation well below the Fed’s target and historical realized levels (see Figure 6). We therefore expect to be overweight U.S. TIPS in multi-asset portfolios on a breakeven basis and look for relative value opportunities in other inflation-linked bond markets. For example, we continue to favor pairing this overweight to U.S. breakevens versus short exposure to U.K. inflation expectations, which appear rich on the back of Brexit risk premium and structural pension buying.
Currencies
A benign Fed outlook serves to anchor core rates at low levels.
The U.S.–China Phase I trade deal along with improving global liquidity and growth impulse should support EM currencies. A benign Fed outlook serves to anchor core rates at low levels.
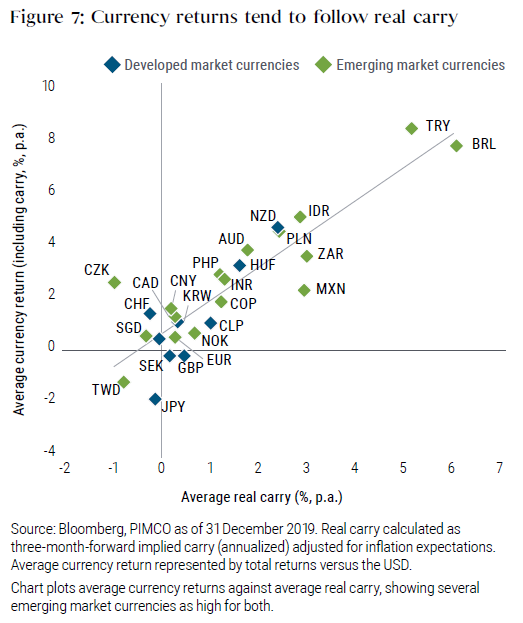
Fundamentally, with the trade-weighted U.S. dollar at multi-decade highs, valuations and carry also support higher-yielding EM currencies (see Figure 7). We favor a diversified basket including the Indonesian rupiah, Russian ruble, Brazilian real, and Mexican peso, funded in U.S. dollars and the euro.
We are broadly neutral on the U.S. dollar versus other G-10 currencies.
As U.S. growth momentum converges toward G-10 peers, we expect modest dollar weakness, though this will likely be mitigated by relatively high U.S. Treasury yields and a stable current account. Therefore, we are broadly neutral on the U.S. dollar versus other G-10 currencies.
In our multi-asset portfolios, we prefer long positions in the Japanese yen, which our valuation models find is cheap. Given our view that front-end rates in the U.S. will be anchored on the cyclical horizon, the yen should be supported versus the dollar. Finally, the yen offers “safe-haven” properties and should hedge some of the cyclical exposures in the portfolio.
We also see further upside for the British pound given the outcome of the U.K. election, though outperformance will require domestic macro improvements as well as the ongoing reduction of Brexit-related policy uncertainty.
Secular drivers: Monitor the disruptors
As we look out over the next decade, we believe technological innovation will be a critical disruptor, changing traditional business models and creating clear-cut winners and losers within industry sectors. Disruption is always at work in the global economy, but there are certainly periods of acceleration. We believe we are encountering such a period that will play out over the next three to five years.
Disruptions tend to materially affect asset valuations, and recent examples abound, including shale oil technology and energy companies, the retail industry’s shift to online sales (which also affects certain segments of commercial real estate), and negative interest rates and regulation affecting bank valuations in Europe.
Recessions or recoveries might play out differently than in the past.
What is clear is that disruption is at odds with the mean-reversion on which many investors rely. When disruption is at work, it usually has profound adverse effects on the disrupted and substantial benefits for the disruptors with very few prospects of returning to the old paradigm. As a result, these factors need to be taken into account when assessing the true value of any company, and in the same vein, recessions or recoveries might play out differently than in the past.
PIMCO sees six major secular themes at work, and when selecting our equity and credit investments we have to look at them through these lenses. The six secular disruptors are the rise of China as a superpower and its rivalry with the U.S., the rise of populism, shifting demographics (aging populations and also the emergence of influential millennials), technological evolutions and revolutions that may be critical to economic dominance, growing vulnerabilities in financial markets, and finally climate change.
How can investors position portfolios to navigate these disruptions?
To offer one example, at PIMCO our equity exposure has become much more targeted and specific in the last two years: We have been increasingly wary of standard factor definitions, as we believe these disruptions are having a profound impact on the true value of businesses.
We focus on countries that our analysis finds are best positioned to succeed amid disruption and to provide a positive environment, and within these countries we seek to identify companies that will thrive while actively avoiding those that are negatively disrupted.
We have found that one effective and efficient approach is to focus on cash flow generation and balance sheet quality, as we believe these offer clear evidence of whether a company is thriving or disrupted. They don’t paint a complete picture of a potential investment, but they help us narrow down and rank companies before we dig deeper. This modified standard valuation method helps us build baskets of companies that we estimate combine cheaper adjusted valuation and higher quality (see Figure 8).
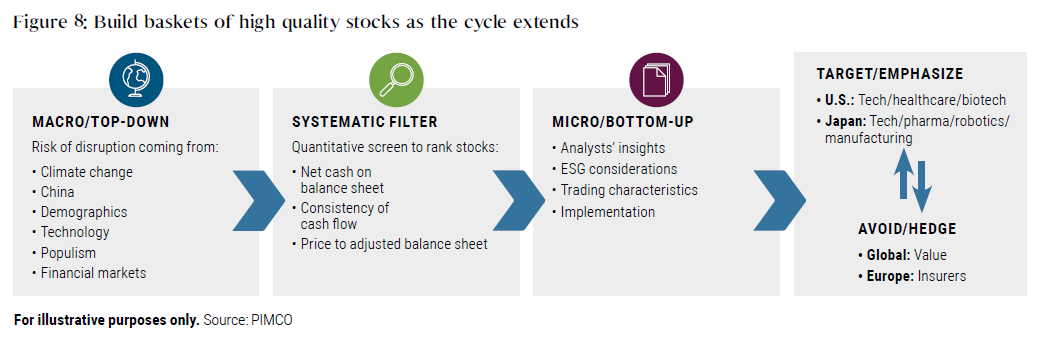
To offer some current and concrete examples, this equity valuation method has led us to overweight exposure to the U.S., China, and Japan, while Europe and many emerging markets seem more disrupted. Looking to sectors, our equity baskets have favored healthcare, biotech, and technology (especially when linked to 5G).
Conclusion
The time to global recession has increased and the much-feared recession seems to have been pushed yet again by supportive politics and policies as shown by our array of recession models.
This is therefore a time to maintain risk levels in our multi-asset portfolios, but the broad asset rally of 2019 leaves us with valuations across asset classes that warrant some rotations. In particular, equities should be the favored instrument to express risk, as credit looks richer, and within equities a tilt toward more cyclical regions and sectors outside the U.S. is also warranted in moderation. While doing so, an important attention to disruption will be necessary, as cycles rhyme rather than repeat, and all cyclicals are unlikely to be equal. Generation of carry within portfolios should be exploited more through foreign exchange (FX) which is more liquid and away from generic corporate credit. Finally, when it comes to risk diversifiers, government duration in the U.S. dollar block remains an adequate instrument, but its effectiveness is likely to be limited by overall low levels of interest rates. As a result, portfolio construction and flexibility will be key in facing the potential risks that 2020 may bring.
Among the potential risks we see on the horizon, the U.S. elections, EU-U.K. trade negotiations, a resurgence of inflation forcing central banks’ hands, renewed geopolitical tensions, or the credit cycle loom large in an environment where expected returns are capped by valuations. Therefore, bottom-up research and ideation are now clear focuses for us in 2020.
The authors would like to thank Bill Smith, Emmanuel Sharef, and Rahul Devgon for their contributions to this paper.
Featured Participants
Disclosures
Past performance is not a guarantee or a reliable indicator of future results.
Investing in the bond market is subject to risks, including market, interest rate, issuer, credit, inflation risk, and liquidity risk. The value of most bonds and bond strategies are impacted by changes in interest rates. Bonds and bond strategies with longer durations tend to be more sensitive and volatile than those with shorter durations; bond prices generally fall as interest rates rise, and low interest rate environments increase this risk. Reductions in bond counterparty capacity may contribute to decreased market liquidity and increased price volatility. Bond investments may be worth more or less than the original cost when redeemed. Sovereign securities are generally backed by the issuing government. Obligations of U.S. government agencies and authorities are supported by varying degrees, but are generally not backed by the full faith of the U.S. government. Portfolios that invest in such securities are not guaranteed and will fluctuate in value. Inflation-linked bonds (ILBs) issued by a government are fixed income securities whose principal value is periodically adjusted according to the rate of inflation; ILBs decline in value when real interest rates rise. Treasury Inflation-Protected Securities (TIPS) are ILBs issued by the U.S. government. Equities may decline in value due to both real and perceived general market, economic and industry conditions. Mortgage- and asset-backed securities may be sensitive to changes in interest rates, subject to early repayment risk, and while generally supported by a government, government-agency or private guarantor, there is no assurance that the guarantor will meet its obligations. Investing in foreign-denominated and/or -domiciled securities may involve heightened risk due to currency fluctuations, and economic and political risks, which may be enhanced in emerging markets. Currency rates may fluctuate significantly over short periods of time and may reduce the returns of a portfolio. Commodities contain heightened risk, including market, political, regulatory and natural conditions, and may not be suitable for all investors. Diversification does not ensure against loss.
Management risk is the risk that the investment techniques and risk analyses applied by an investment manager will not produce the desired results, and that certain policies or developments may affect the investment techniques available to the manger in connection with managing the strategy.
There is no guarantee that these investment strategies will work under all market conditions or are suitable for all investors and each investor should evaluate their ability to invest long-term, especially during periods of downturn in the market. Investors should consult their investment professional prior to making an investment decision.
Forecasts, estimates and certain information contained herein are based upon proprietary research and should not be interpreted as investment advice, as an offer or solicitation, nor as the purchase or sale of any financial instrument. Forecasts and estimates have certain inherent limitations, and unlike an actual performance record, do not reflect actual trading, liquidity constraints, fees, and/or other costs. In addition, references to future results should not be construed as an estimate or promise of results that a client portfolio may achieve.
The terms “cheap” and “rich” as used herein generally refer to a security or asset class that is deemed to be substantially under- or overpriced compared to both its historical average as well as to the investment manager’s future expectations. There is no guarantee of future results or that a security’s valuation will ensure a profit or protect against a loss.
A “safe haven” currency is a currency perceived to be low risk due to the stability of the issuing government and the strength of the underlying economy. All investments contain risk and may lose value.
Alpha is a measure of performance on a risk-adjusted basis calculated by comparing the volatility (price risk) of a portfolio vs. its risk-adjusted performance to a benchmark index; the excess return relative to the benchmark is alpha. Beta is a measure of price sensitivity to market movements. Market beta is 1. M1 is the money supply that is composed of physical currency and coin, demand deposits, travelers' checks, other checkable deposits, and negotiable order of withdrawal (NOW) accounts. The Sharpe Ratio measures the risk-adjusted performance. The risk-free rate is subtracted from the rate of return for a portfolio and the result is divided by the standard deviation of the portfolio returns.
PIMCO as a general matter provides services to qualified institutions, financial intermediaries and institutional investors. Individual investors should contact their own financial professional to determine the most appropriate investment options for their financial situation. This material contains the opinions of the manager and such opinions are subject to change without notice. This material has been distributed for informational purposes only and should not be considered as investment advice or a recommendation of any particular security, strategy or investment product. It is not possible to invest directly in an unmanaged index. Information contained herein has been obtained from sources believed to be reliable, but not guaranteed. No part of this material may be reproduced in any form, or referred to in any other publication, without express written permission. PIMCO is a trademark of Allianz Asset Management of America L.P. in the United States and throughout the world. ©2020, PIMCO.